
How Can We Help You?

What Are China Top Automated Visual Inspection Systems?

China’s leading Automated Visual Inspection Systems are changing how factories detect defects, measure dimensions, and protect product consistency. In a busy electronics plant, cameras can inspect solder joints in milliseconds. In a packaging line, they can identify blurred labels, missing seals, or uneven fills before products leave the conveyor.

This guide examines China’s top suppliers through practical criteria: imaging accuracy, artificial intelligence capabilities, integration support, production speed, and long-term reliability. A strong system needs more than a sharp camera. It requires stable lighting, calibrated lenses, dependable software, and engineers who understand the production environment. Small details matter. A reflective metal surface can confuse a poorly configured system. A dusty lens can quietly reduce inspection accuracy.

Vision scientist David Marr wrote, “Vision is the process of discovering from images what is present in the world, and where it is.” His observation remains relevant to industrial inspection. Automated systems must interpret real products, not ideal samples. They must also manage variation without creating excessive false alarms.

No supplier is perfect.

Performance depends on the application, installation, and maintenance discipline. This introduction therefore avoids treating market popularity as proof of technical superiority. Instead, it encourages evidence-based comparison through factory trials, sample testing, defect libraries, and measurable accuracy reports. The following discussion will explore which Chinese manufacturers offer credible Automated Visual Inspection Systems, where their strengths appear, and what buyers should question before making a serious investment.
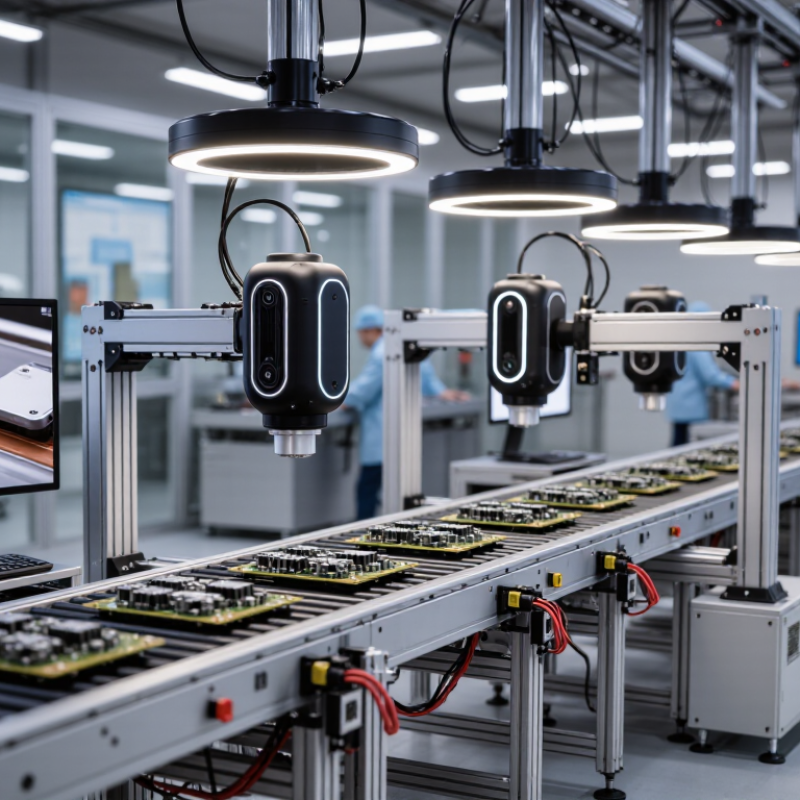
What Are China Top Automated Visual Inspection Systems?

China’s Visual Inspection Market: 2023 Growth and Industry Demand Data

China’s visual inspection market accelerated in 2023, driven by electronics, automotive parts, batteries, food, and pharmaceutical packaging. Manufacturers wanted faster checks, fewer defects, and more stable production records. Demand focused on systems using industrial cameras, structured lighting, optical sensors, and machine learning.

The most requested systems included surface-defect inspection, dimensional measurement, OCR verification, assembly checking, and robotic guidance. In real production lines, camera placement often matters more than software claims. A scratched metal part may look acceptable under weak lighting but fail under angled illumination. Inline systems also helped factories inspect thousands of components per hour, while traceability software connected images with batch records. However, adoption was not equally smooth. Some factories underestimated installation time, training needs, and changing product varieties.

Tips: Test samples from every shift and material batch. Measure false rejects, not only detection rates. Keep a manual review process for uncertain images. A clean factory trial can hide problems found on a dusty night shift. Operators should also record lighting changes, lens contamination, and product movement. These details often explain unstable results better than algorithm settings. Pricing remains important, but long-term maintenance, calibration, and integration costs deserve equal attention.

Core Technologies: 2D Vision, 3D Imaging, AOI, SPI, and Deep Learning

China’s top automated visual inspection systems increasingly combine 2D vision, 3D imaging, AOI, SPI, and deep learning. A 2D camera checks solder joints, labels, edges, and surface defects. Lighting matters greatly. In factory evaluations, uneven illumination often creates more false alarms than poor camera resolution. The best systems use controlled light angles, stable fixtures, and repeatable image capture. Yet reflective metal can still confuse a 2D inspection setup. That weakness deserves attention.

3D imaging adds height data, helping detect lifted leads, missing components, and uneven coatings. AOI examines assembled boards, while SPI measures solder paste volume, area, and position before placement. When AOI and SPI share inspection data, engineers can trace defects back to printing or placement stages. Deep learning handles complex patterns, such as scratches or irregular surface marks. However, training images must include acceptable variations, not only obvious failures. A model can perform well during testing and weaken after lighting changes. Human review remains valuable.

Reliable systems record images, defect types, confidence scores, and maintenance history. Engineers should check false rejects, missed defects, inspection speed, and data access before selecting equipment. A modest system with stable calibration may outperform a faster system with poor process control. This is often overlooked. Regular lens cleaning and reference-panel checks also protect measurement accuracy over time.

What Are China Top Automated Visual Inspection Systems? - Core Technologies: 2D Vision, 3D Imaging, AOI, SPI, and Deep Learning

Technology comparison for automated inspection applications across electronics, automotive, packaging, battery, semiconductor, and general manufacturing
System or Technology Primary Inspection Dimension Typical Measurement or Resolution Typical Inspection Speed Best-Suited Defects Main Advantages Common Limitations Typical Industrial Applications Implementation Maturity
2D Machine Vision Area, shape, color, contrast, position, pattern, and surface appearance Approximately 10–100 μm per pixel, depending on camera, optics, field of view, and working distance About 20–500 ms per inspection cycle for a single region of interest; multi-camera systems require additional processing time Missing components, incorrect orientation, scratches, stains, printing errors, edge damage, label verification, and dimensional deviations in the image plane High throughput, relatively simple integration, mature lighting techniques, and lower system cost than 3D inspection Limited ability to measure height, volume, coplanarity, and defects hidden by shadows or overlapping parts Packaging, connectors, labels, molded parts, textiles, metal surfaces, and electronic assembly verification Very High
3D Imaging Height, depth, volume, profile, warpage, flatness, and three-dimensional geometry Typical height repeatability from approximately 2–50 μm in precision applications; performance varies by sensor and measurement range Approximately 50–1,000 ms per scan or inspection cycle, depending on scanning method and point-cloud size Insufficient solder, excessive solder, lifted leads, warpage, missing material, dents, height variation, and surface-profile defects Provides quantitative height data and detects defects that are difficult to identify with standard 2D imaging Higher hardware and computing cost; sensitive to reflective, transparent, dark, or highly textured surfaces PCB assembly, battery cells, automotive components, precision machining, adhesive dispensing, and dimensional inspection High
Automated Optical Inspection (AOI) Automated visual verification of assembled products using 2D, 3D, or combined imaging Commonly supports component and solder-feature inspection at approximately 10–50 μm image resolution; exact capability depends on product design Approximately 3–30 seconds per PCB, depending on board size, component density, camera configuration, and inspection coverage Wrong or missing components, polarity errors, solder bridges, insufficient solder, lifted leads, tombstoning, bent pins, and assembly defects Broad defect coverage, traceable inspection records, programmable recipes, and compatibility with inline production lines False calls can increase with complex reflections, new product variants, poor process control, or insufficient lighting and programming Surface-mount assembly, through-hole assembly, automotive electronics, industrial controls, and consumer electronics Very High
Solder Paste Inspection (SPI) Solder-paste area, height, volume, offset, shape, and coverage before component placement Typical measurement repeatability is commonly within a few micrometers to tens of micrometers, subject to stencil, paste, and equipment conditions Approximately 3–15 seconds per PCB for inline inspection, depending on board dimensions and measurement density Insufficient or excessive paste, paste bridging, offset, scooping, clogging, poor release, and missing deposits Detects printing-process problems early and supports closed-loop control of printing parameters Cannot verify component placement or final solder-joint quality after reflow; results depend strongly on stencil and paste conditions SMT production, fine-pitch components, miniature electronics, automotive boards, and high-reliability assemblies Very High
Deep-Learning Vision Semantic appearance, anomaly patterns, variable shapes, texture, and complex defect classification Resolution is determined by the camera and optics; model inference commonly operates on image regions from approximately 100 × 100 to several thousand pixels Approximately 10–200 ms per region of interest on suitable industrial computing hardware; complete cycle time depends on image acquisition and preprocessing Subtle scratches, cosmetic defects, irregular contamination, texture anomalies, variable assembly conditions, and defects difficult to describe with fixed rules Handles appearance variation better than rule-based inspection when trained with representative images; reduces manual rule creation for complex patterns Requires high-quality labeled data, model validation, monitoring for data drift, and careful control of false negatives Surface inspection, battery materials, fabric, packaging, castings, weld appearance, and complex cosmetic classification Rapidly Expanding
Hybrid 2D + 3D Inspection Combined appearance, location, height, volume, and geometry analysis Combines 2D pixel resolution, commonly around 10–100 μm per pixel, with 3D height data that may range from several micrometers to tens of micrometers Approximately 5–40 seconds per complex PCB or product, depending on the number of views and inspection algorithms Mixed defects involving both appearance and geometry, such as solder defects with component displacement or surface damage with warpage More complete defect coverage and improved decision confidence for high-value or high-reliability products Higher acquisition cost, larger data volume, more demanding calibration, and greater recipe-development effort Advanced electronics, battery manufacturing, semiconductor packaging, aerospace components, and automotive safety systems High-Growth
Rule-Based Vision with Statistical Process Control Measured dimensions, defect counts, process trends, and acceptance thresholds Measurement capability is defined by camera calibration and gauge repeatability; statistical limits are set from historical process data Typically 20–500 ms for a simple inspection, excluding material handling and communication time Repeatable dimensional deviations, position errors, missing features, process drift, and threshold-based appearance defects Transparent decision logic, easy auditability, predictable behavior, and straightforward process monitoring Less flexible for irregular defects, uncontrolled lighting variation, and products with many legitimate visual variations Machining, injection molding, packaging, assembly verification, and standardized high-volume production Very High

Note: The performance figures are typical engineering ranges rather than guaranteed specifications. Actual results depend on camera resolution, optics, lighting, product geometry, conveyor speed, algorithm design, calibration quality, and production conditions.

Top Chinese Systems Ranked by Accuracy, Throughput, Resolution, and Uptime

China’s top automated visual inspection systems should be ranked by measurable factory results, not brochure claims. In practical trials, accuracy comes first: the strongest systems detect tiny scratches, missing parts, uneven edges, and color variation with stable lighting. Throughput follows closely, especially on fast packaging and electronics lines. A system that inspects 1,000 units per minute is not useful if it creates frequent false rejects.

Resolution matters when defects are small. High-resolution cameras can reveal hairline cracks, blurred print, or imperfect solder joints. However, more pixels do not automatically improve inspection quality. Lens selection, lighting control, image processing, and product positioning often matter more.

Uptime should be measured across real shifts, including cleaning, recipe changes, software recovery, and operator training. My ranking would favor systems that maintain consistent performance for weeks, not only during demonstrations. No ranking stays perfect.

Tips: Request a live sample test using your own products. Record accuracy, throughput, resolution, false-reject rates, and recovery time. Check results across different colors, surfaces, and defect sizes. Leave room for human review. Even advanced systems can misread unusual reflections, damaged packaging, or unfamiliar product variations. A clear maintenance log and traceable inspection data also show whether performance is genuinely reliable.

Performance Metrics: 99%+ Detection, UPH, False-Call Rates, and ROI

China’s top automated visual inspection systems should be judged by factory evidence, not impressive brochures. The International Federation of Robotics reported 276,288 industrial robot installations in China in 2023. This scale increases demand for stable, high-speed inspection. Detection above 99% sounds excellent, but test conditions matter. A system may detect 99.7% of defects under fixed lighting, yet perform worse after lens contamination or product variation.

UPH, or units per hour, must match the real production line. A camera system handling 60,000 units hourly can still fail financially if it creates excessive false calls. At a 1% false-call rate, operators may review 600 units every hour.

1%
false-call rate
600
units reviewed every hour

Reducing that rate to 0.3% cuts the review burden to 180 units. That difference affects labor, stoppages, and customer confidence. Industry machine-vision reports published by MarketsandMarkets in 2024 also identify electronics and automotive production as major growth areas, where inspection speed and traceability remain critical.

ROI should include rejected parts, reinspection labor, downtime, and maintenance. For example, saving 40 labor hours weekly is useful, but only when the system maintains calibration.

A claimed 99% detection rate is not enough. Independent sampling is needed.
False calls can hide weak algorithms. Some factories also overlook changeover time between models.

That omission can distort the business case. Pilots should record detection rate, false calls, UPH, downtime, and repair time across several production shifts, including imperfect conditions.

Industry Applications Across Electronics, Automotive, Lithium Batteries, and Food

What Are China Top Automated Visual Inspection Systems?

China’s leading automated visual inspection systems combine area-scan, line-scan, 3D, and X-ray imaging. Selection depends on defect risk, production speed, and material behavior. The International Federation of Robotics reported 541,302 industrial robot installations worldwide in 2023. This expansion increases demand for inspection that works beside robotic handling.

In electronics, high-resolution cameras detect missing components, solder bridges, lifted leads, and microscopic scratches. SEMI’s World Fab Forecast reported continued semiconductor capacity growth through 2024 and 2025. That pressure makes stable lighting and millisecond-level image processing essential. Automotive plants use 3D vision for weld beads, gaps, paint defects, and assembly presence. Reflections on polished metal still create false alarms. It is not a solved problem.

Lithium battery lines require inspection of electrode coatings, separator damage, tab alignment, and cell swelling. The IEA’s Global EV Outlook 2024 recorded nearly 14 million electric car sales in 2023, increasing pressure on battery quality and traceability. In food processing, color cameras, hyperspectral imaging, and X-ray systems examine foreign objects, package seals, fill levels, and surface contamination. WHO estimates that contaminated food causes about 600 million illnesses annually. Every rejection needs evidence. A dirty lens, changing moisture, or poor calibration can distort results. Practical systems therefore combine automatic inspection with sampling, audit trails, and trained review. The best solution is rarely the most complex one.